Productspecifications
| Product Name | Watermark Quality Analysis Software (WQA) |
| Product Code | LPB02 |
| Test Material | Paper, Tissue, Board |
| Manufacturer | OpTest Equipment Inc. |
| Availability from OpTest | Worldwide |
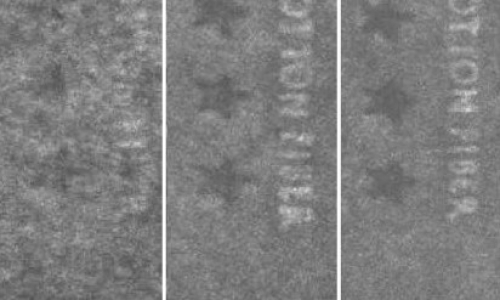
Watermarks provide security features and/or product identification in paper. Watermarks are traditionally examined using visual testing.
Visual assessment lacks sufficient precision and sensitivity to optimize quality and maintain the papermaking performance.
A definition of a good watermark depends upon the product end-use: sharp watermarks may be desired for security papers and undesired for some printing papers. Consequently, watermark quality analysis usually requires a reference watermark image for comparison.
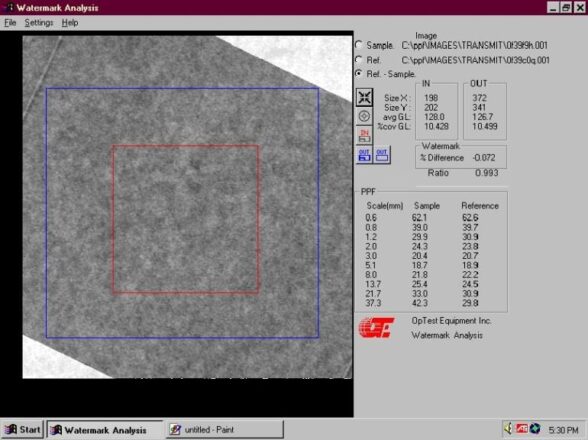
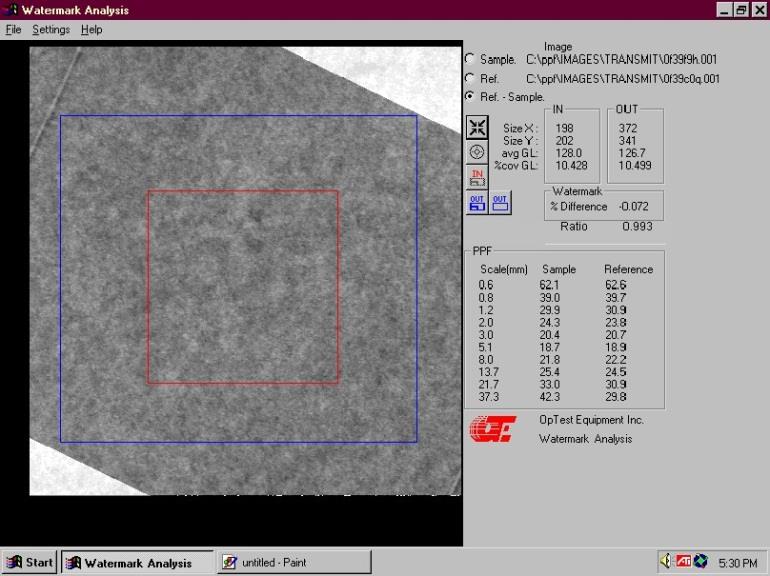
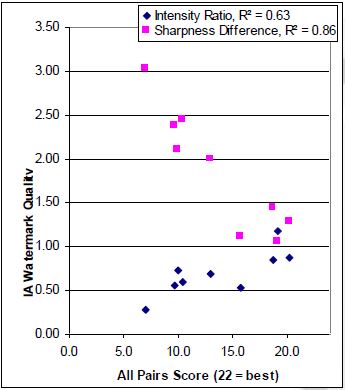
Watermarks are imaged in transmitted light with the PPF or Micro-scanner, and images stored. The stored Sample images are opened by the Watermark Image Analysis software. The Watermark Intensity Ratio and Sharpness Difference are then determined relative to a Reference image. The results include:
• The Background Formation quality, %COV
• Sample Watermark %-Intensity
• The Intensity Ratio of the Sample watermark relative to the Reference. If greater than 1, then Intensity of the Sample is greater than the Reference, and vice versa.
• The Sharpness Difference of the Sample relative to the Reference. If the value is positive, then the Sharpness of the Reference watermark is greater than the Sample
ADVANTAGES
• Comparison with watermark’s artwork, or with user selected reference watermarks
• Windows™ based, bitmap storage and retrieval, Excel™ ready data and print-outs
• Faster, more precise and objective compared to visual testing
• Highly correlated with visual assessment
SYSTEM REQUIREMENTS
Computer:
• Computer with Pentium Processor, 1+ Ghz, 250+ MB RAM, USB port
• Latest Versions Windows™
• Microsoft Office™
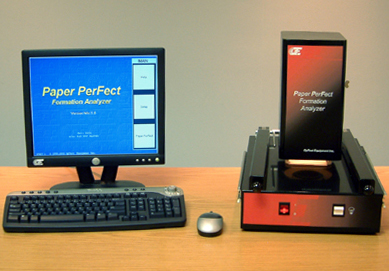
Optics Platform:
• Paper PerFect Formation Analyzer
• Paprican Micro-Scanner
or,
• Camera with IR filter and an optical resolution of 70 to 150 μm /pixel
• A pixel array of 480 H x 480 V
• Pixel signal of 256 GL (8 bit, monochrome)
• Average Signal Level: 50 +/- 3% of Full Scale (i.e. 128 GL in 8 bit sensitivity)
• Lighting non-uniformity < 1% (after mapping)
• Resulting images saved as a bitmap (*.bmp)
OPTIONS
• Paper PerFect Formation Analyzer
• Paprican Micro-Scanner
• Software: Excel and/or Photoshop
Download PDF
Brochure_WQA_LPB02-1.pdfMore information?
Contact us